There are three kinds of lies: lies, damned lies, and statistics
Sir Charles Dilke
Last weekend, I saw this article, Study: Grand Rapids has highest rate of depression nationwide, on my Facebook timeline that highlighted Grand Rapids, MI as the most depressed city, amongst large cities, in the United States. The magnitude of this claim sparked my interest in the data and underlying study design. During the course of my snooping, I found that the article was based on a study with dubious statistics that attempted to make inferences far beyond what the data would suggest. Here is the original study link from insuranceproviders.com.
Rather than outrightly can this news article as fake news, I’ll use this piece to introduce some concepts of statistical inference[1] and how the underlying study, amongst other flaws, violates its principles.
Beware of biased samples
The goal of statistical inference is to make intelligent statements about a population based on a sample statistic. For this practice to be possible, one has to acquire samples that are sufficiently representative of the population in question. For example, to know the most popular music genre among the Generation Z demographic in America, one would need to survey one or more samples of Gen Z’ers. Sampling the Baby Boomer demographic will produce a non representative sample.
With the lenses of the context established above, we will look at how the sampling was performed for the survey that this flawed study is based on. The published study is based on the data from Behavioral Risk Factor Surveillance (BRFSS) survey responses from the Center for Disease Control and Prevention (CDC) for year 2017. Here, the CDC provides insight on how it collected these data –
“States generally follow a suggested BRFSS interviewing schedule and complete all calls for a given survey month within the same sample month. Up to 15 calling attempts may be made for each phone number in the sample, depending on state regulations for calling and outcomes of previous calling attempts”.
That the survey medium is a telephone call biases the sample right out the gate. The survey design automatically eliminates individuals without phones and phone numbers. This means that valuable data from depressed (or non-depressed) individuals without phone numbers will not be captured in the surveyed sample. Another flaw with the survey design is that it virtually eliminates individuals that are less likely to answer calls from random numbers. Surveying for depression over the phone is akin to surveying for Medicare satisfaction ratings on Instagram. One needs minimal proof to show that the general demographic of instagram users does not exactly overlap with the population of folks on Medicare insurance. In the case of the CDC’s BRFSS survey, the telephone medium is inherently not random and ultimately renders the resulting samples biased and non representative of the population of interest.
Size matters
Suppose we wanted to know what proportion of Americans prefer pineapple on their pizzas, we would effectively have to ask and receive responses from the entire country. Knowing that this is logistically not feasible, our best alternative is to use a sample. Now, consider these two scenarios:
- Scenario 1: We survey 2 random people. One of them prefers pineapple on their pizza and the other doesn’t. We go on TV and announce “50% of Americans prefer pineapples on pizza”
- Scenario 2: We survey 100,000 random people. Half of them prefer pineapple on pizza and the other half do not. We go on TV and announce “50% of Americans prefer pineapples on pizza”
What news story are you more likely to believe?
Because a statistic is an approximation of the real world parameter, the more samples or data one has, the more likely the statistic converges to the real world value [2]. This is why you can get 3 heads on tossing a fair coin 3 times but you’ll be hard pressed to get 1000 heads on tossing the same coin 1000 times.
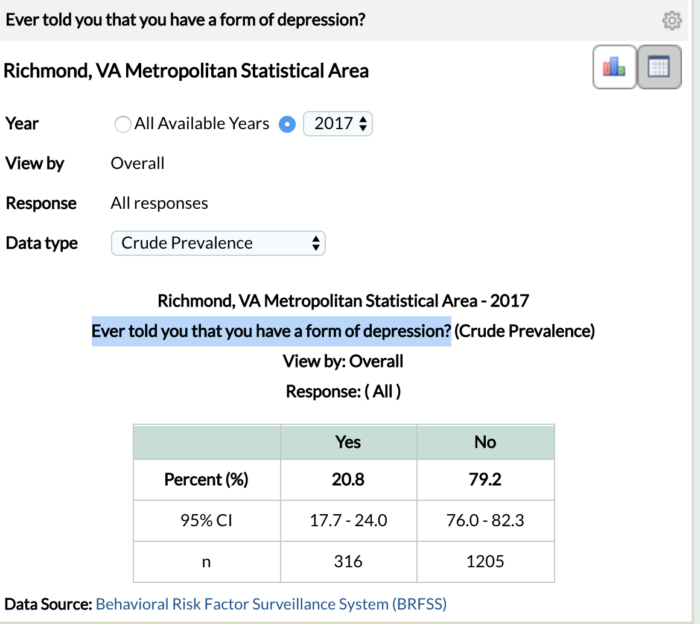
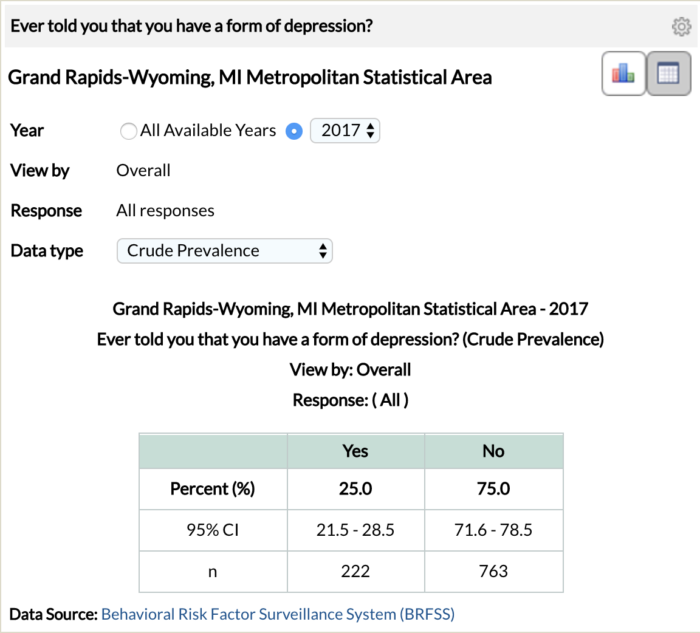
Let’s look at the relative sample sizes for the 1st and 16th most depressed cities, amongst large metropolitan areas, from the study. The Grand Rapids-Wyoming Metro statistical area is ranked 1st with a 25.0% depression rate and the Richmond, Virginia Metro Statistical area is ranked 16th with a 20.8% depression rate[3]. To arrive at these percentages, 222/985 survey respondents in the Grand Rapids metro area and 316/1521 in the Richmond metro area responded to having depression.
The fact that 536 (1521 minus 985) more people were included in the Richmond sample than that of Grand Rapids weakens the credibility of the Grand Rapids depression statistic and its ability to estimate the true depression rate. All things being equal, statistics derived from larger sample sizes are more credible than those derived from smaller sample sizes. As statistical values, 1/4, 10/40 100/400, 1,000,000/4,000,000 all equate to 25.0% but do not all have the same degree of believability.
Never trust a stand-alone number
Let’s revisit the definition of a statistic. A statistic is an approximation of a certain value in the population of interest. We resort to statistics because we cannot directly capture this true population value. Given that a statistic is an estimate and not the true value, it would be irresponsible to report it or base decisions on it without quantifying how much we think this estimate approximates (or does not approximate) the true population value. We can achieve this error quantification by placing the statistic between confidence bounds. A confidence bound reports the range of the possible values of the true population value with a certain degree of confidence. Also, the width of the confidence bound implicitly helps us calibrate our degree of belief in the reported statistic as a good estimate of the true population value. Ceteris paribus, a narrower bound is better than a wider one.
For example, a study with the conclusion that 19% of Australians believe in aliens with a 95% confidence bound of (17% , 23%) means that ninety five times out of a hundred, the true value of the percentage of Australians that believe in aliens is somewhere between 17% and 23%.
One great benefit of confidence bounds is that they aid in the comparison of similar statistics. Remaining on the alien theme, a study might want to determine whether Americans are more likely to believe in aliens than Australians. From the example above, we know that 19% of Australians believe in aliens with a 95% confidence bound of (17%, 23%). Let’s imagine that our American research counterparts report that 22% of Americans believe in aliens with a 95% confidence bound of (20%, 24%). One would be naturally inclined to conclude that Americans are more likely to believe in aliens than Australians (22% is greater than 19%) but closer inspection of the respective confidence bounds should prompt a hesitation in making such a conclusion. Closer inspection shows that the respective confidence bounds overlap. The maximum value of the confidence bound for the Australian study (23%) is contained in that of the American study (20%, 24%). Likewise the minimum value of the confidence bound for the American study (20%) is contained in the range of values for the American study (20%, 24%). Because of this overlap in confidence bounds, we can conclusively say that we do not have enough evidence that Americans are more likely to believe in aliens than Australians. Failing to arrive at this conclusion is the danger that comes with trusting stand alone statistics without reporting and respecting their confidence bounds. Below we’ll see how this concept plays out in the depression study.
Now, the CDC actually reports the confidence bounds for their study statistics.

The screenshots above are from the CDC website. The Grand Rapids – Wyoming metro statistical area ranks 1st with a 25% depression rate and a 95% confidence bound of (21.5%, 28.5%). The Richmond metro statistical area ranks 16th with a 20.8% depression rate and a 95% confidence bound of (17.7%, 24.0%). Similar to our contrived alien study above, we observe an overlap in the confidence bounds for the depression rates of Grand Rapids, MI and Richmond, VA.
What is our conclusion here? Simply, we do not have enough evidence to assert that the depression rate in 16th ranked Richmond, VA is different from that of the first ranked, Grand Rapids, MI.[4]
Lies
The most damning evidence on the illegitimacy of the insuranceproviders.com study and the derived news reports is that it is based on a lie, plain and simple. From the CDC website, the actual survey questioned asked was –
“Ever told you that you have a form of depression?”.
Compare the above survey question to what was reported on the insuranceproviders.com website –
“According to data from the Centers for Disease Control and Prevention BRFSS Survey, almost one in five Americans have been diagnosed with depression at some point in their lives”.
We’ll place an emphasis on the word “diagnosis” which we will come back to in subsequent paragraphs.
First, let’s address the fact that the survey question is a bad one. Ever told you that you have a form of depression? is such a broad question that it gives too much latitude for subjective interpretation. In fact, you are well within your rights to respond in the affirmative to this question if you have been told that you have depression by a random stranger on the internet or by your dog even.
Now, how one interprets a survey question as vague and as subjective as such as a definitive diagnosis is mind boggling. A diagnosis has a very precise definition. It can only be carried out by certain kinds of professionals in certain kinds of places. The conversion of a subjective survey question to a “diagnosis” is a clever sleight of hand. It is a lie. This fact alone invalidates the insuranceproviders.com “study” and all the news reports based on it. We do not need fancy statistics to come to this conclusion.
In summary,
The road to illegitimate studies (and possibly hell) is paved with biased samples, small sample sizes, unbounded/standalone statistics, and lies.
Myself
Footnotes
- Specifically frequentist statistical inference, Bayesian Inference is outside the scope of this post
- Of course this assumes that the sample is not inherently biased
- It would be unfair if I didn’t disclose that I cherry picked Richmond, VA out of all other cities to compare Grand Rapids, MI with. This fact does not weaken the argument.
- The reader already familiar with basic statistical inference will observe that this method is simply failing to reject the null hypothesis in a classic hypothesis test with a p-value of 5%.
